
Markets tend to mask things. An index near record highs signals health to the casual observer; a closer reading of participation tells a different story.
In the current episode, the S&P 500's sharp recovery from its April lows has been powered by a remarkably thin set of names, primarily large AI and technology platforms, while the rest of the index has barely moved.
Goldman Sachs equity strategist Ben Snider put it plainly in a late May 2026 note: the momentum rally has pushed U.S. equity market breadth to one of its narrowest levels in recent decades outside of the Dot Com Bubble.
That reference is not rhetorical. Snider's preferred breadth gauge measures the gap between the distance the index sits from its 52 week high and the distance the median constituent sits from its own.
At present, that spread has reached levels unseen since the turn of the millennium, with the mid-2023 episode the only intervening parallel.
Outside those two windows, you have to go back approximately a quarter century to find a market this top heavy.
Table of contents
- Top 10 Constituent Weight in the S&P 500 (1990 to 2025)
- Inside the Numbers
- The AI Concentration Engine
- Limits of This Analysis
Top 10 Constituent Weight in the S&P 500 (1990 to 2025)
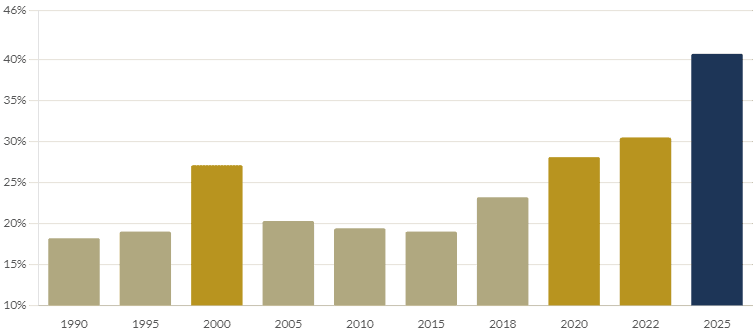
The numbers behind this are stark. By year end 2025, the ten largest companies in the S&P 500 collectively accounted for roughly 40.7% of the index by market capitalization, more than doubling their share from a decade earlier, when the same cohort represented approximately 18% to 19% of total weight.
RBC Wealth Management, drawing on FactSet data, notes the figure hovered stably between 18% and 23% from 1990 all the way through 2015 before beginning its steep ascent in the AI era.
The earnings arithmetic does not fully support the valuation wedge. In 2025, those same ten companies were expected to generate roughly 32% of index earnings, against their 41% weight.
The gap between capital weight and earnings contribution has widened significantly since 2015, when the two figures were far closer to parity.
What this means in practice is that investors in a standard cap weighted S&P 500 fund are paying an earnings multiple premium simply by owning the benchmark passively.
Inside the Numbers
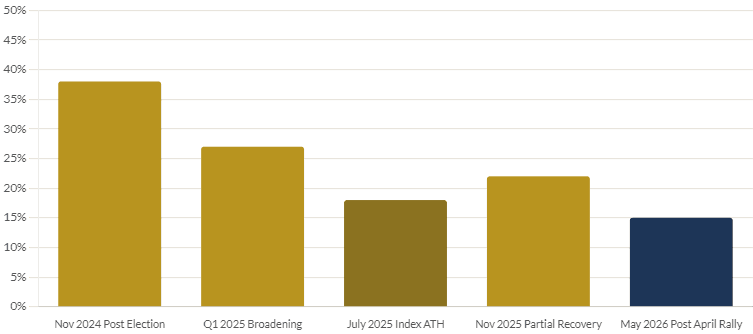
The percentage of S&P 500 stocks trading above their 50 day moving average is a standard breadth gauge. It peaked broadly during the November 2024 post election rally and showed a brief improvement into early 2025, before deteriorating again as the momentum trade reasserted itself.
Morningstar data from July 2025 found that only 18% of stocks in the Large-Mid Index had reached a new 52 week high that month, even as the index itself pushed to all-time highs. More than half of constituents were trading at least 10% below their own 52 week peaks at the time.
By the time Goldman's May 2026 research landed, the picture had barely improved at the index level. The median S&P 500 constituent sat roughly 13% below its 52 week high despite the benchmark sitting close to a record.
Goldman's own Panic Index, a composite of implied one-month volatility and the VIX, approached what the bank defines as a maximum fear threshold during the same period, a combination that historically correlates with elevated drawdown risk over the following six to twelve months.
The AI Concentration Engine
Concentration this extreme rarely appears without an identifiable catalyst. Here, it is the AI infrastructure buildout.
Goldman Sachs estimates that AI related investment will account for roughly 40% of S&P 500 earnings growth in 2026, with the largest cloud computing companies planning aggregate capital expenditure of approximately $670 billion over the year. A Goldman basket of stocks tied to AI data centre construction returned nearly 60% in the year through early 2026.
The same spending wave that flatters certain earnings lines creates a compression effect across the rest of the market. The uncertainty surrounding AI disruption has weighed on valuations for industries facing displacement, and even the megacap technology names themselves have seen multiple compression as investors wait for revenue acceleration to justify the capital intensity.
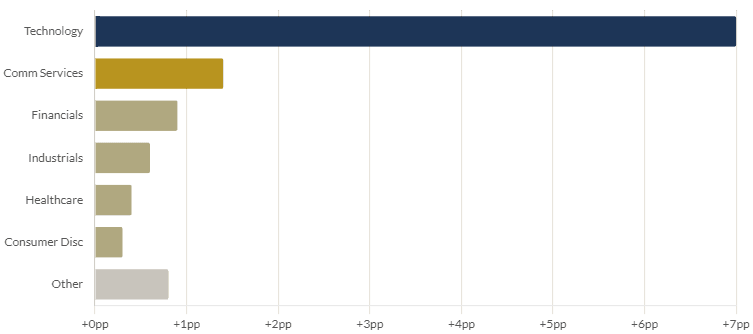
Technology stocks accounted for approximately 7 of the 11.4 percentage points gained by the Large-Mid Index in Q2 2025, according to Morningstar data, underscoring how thoroughly sector specific the rally has been.
Limits of This Analysis
- Structural differences from 2000. The largest constituents today are highly profitable, asset light businesses with strong free cash flow generation. This distinguishes them from the speculative Dot Com era names that powered the 1999 to 2000 concentration. A correction, if it occurs, may be shallower than the Nasdaq experience referenced above.
- Earnings path dependency. Goldman's constructive base case rests on 12% EPS growth in 2026. If AI capital expenditure delivers the revenue acceleration required to justify it, particularly for the megacap platforms bearing the infrastructure cost, then breadth may broaden organically rather than through a corrective rotation.

